Many times you think how to extract some information from memory.dmp generated by Windows once it crashes. Let’s have a look into quick process, which might be very helpful in many cases during troubleshooting unexpected BSODs on client computers.
Before we start we need tool, WinDbg, which is available on Microsoft.com. In order to download WinDbg go to WDK and WinDbg downloads on Microsoft. On that page locate section Standalone Debugging Tools for Windows (WinDbg).
Once you download and install WinDbg we are ready to start.
So, let’s see what’s in memory.dmp…
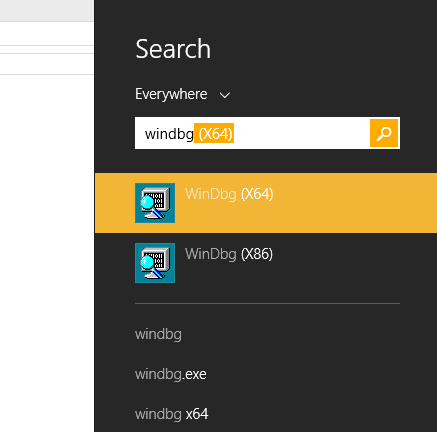
First let’s find and start WinDbg….
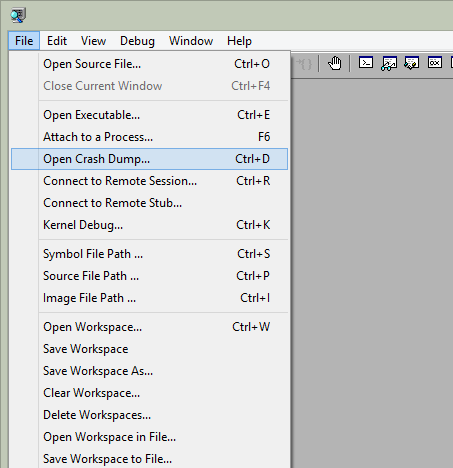
Then from File menu choose Open Crash Dump…
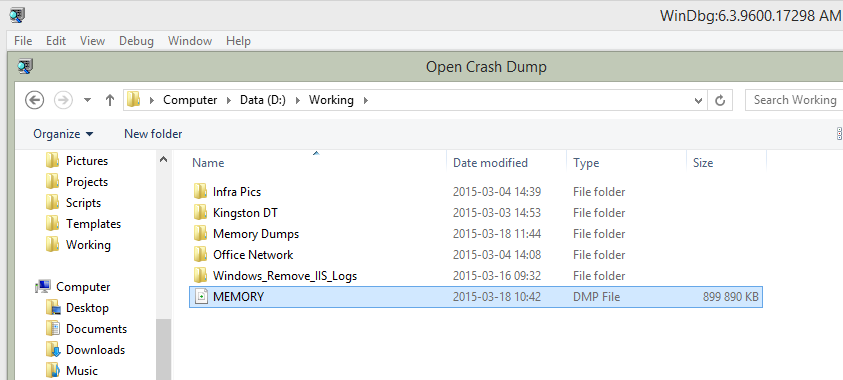
Locate memody.dmp file and open it…
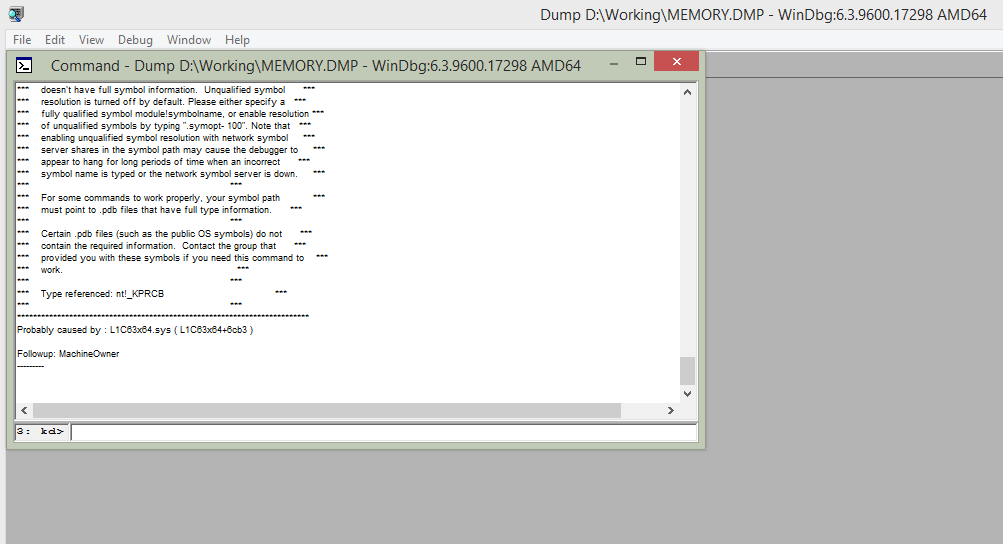
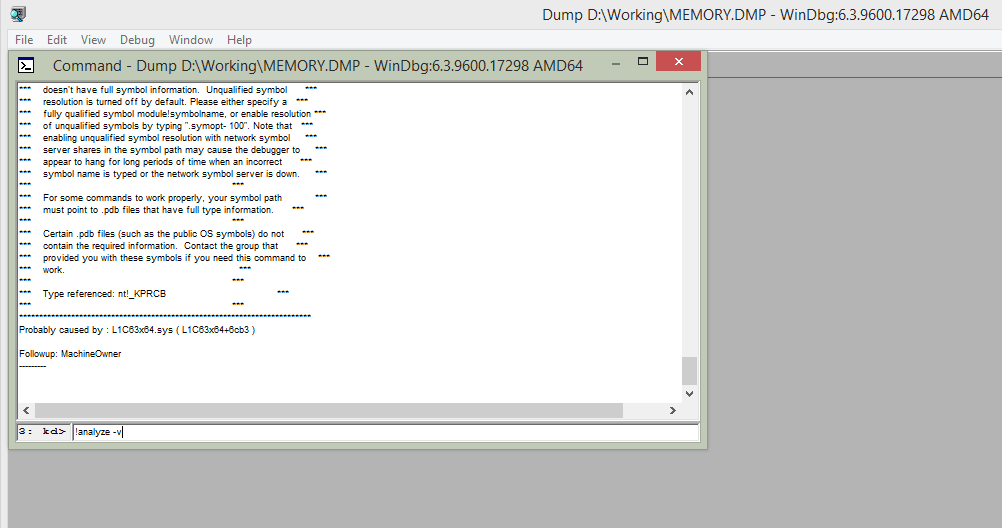
WinDbg will open memory.dmp and first thing you can notice is information:
“Probably caused by: …..”
That gives us overview what potentially could cause BSOD
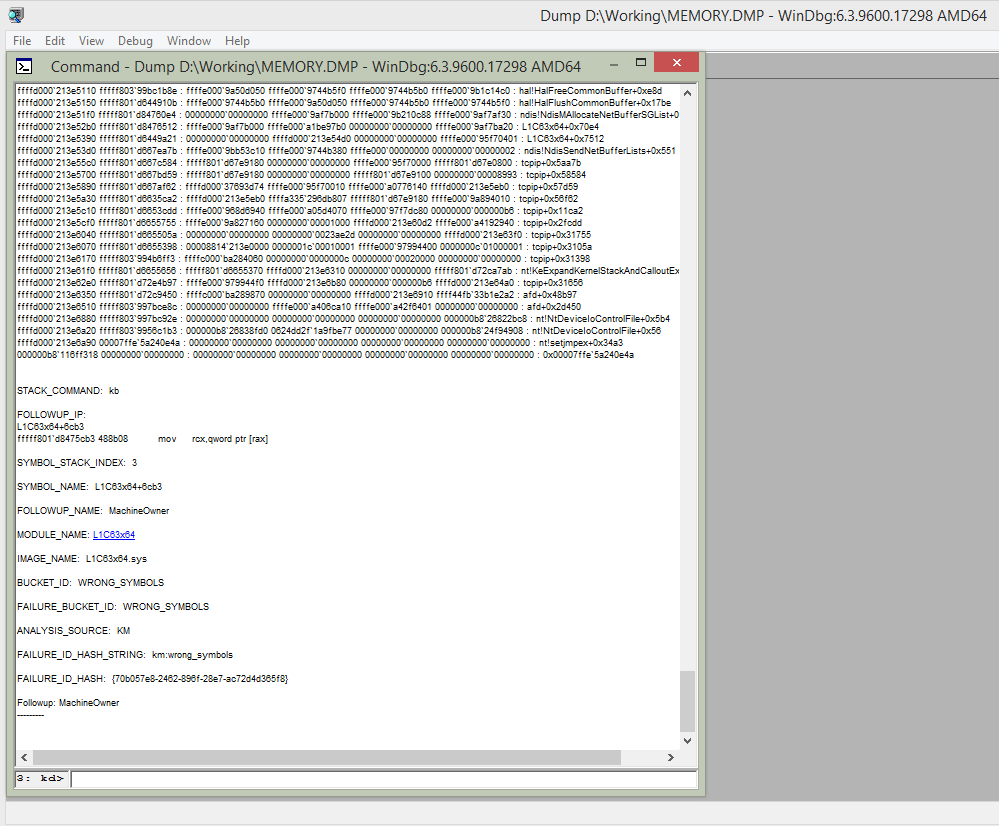
If more details is required then use command:
!analyze -v
That will provide extensive information about suspected activity which drove us to system crash.
Now enjoy WinDbg and memory.dmp 🙂

Might be useful to add symbols URL with windbg and other troubleshooting tools to get more user friendly messages 🙂
https://support.microsoft.com/en-us/kb/311503